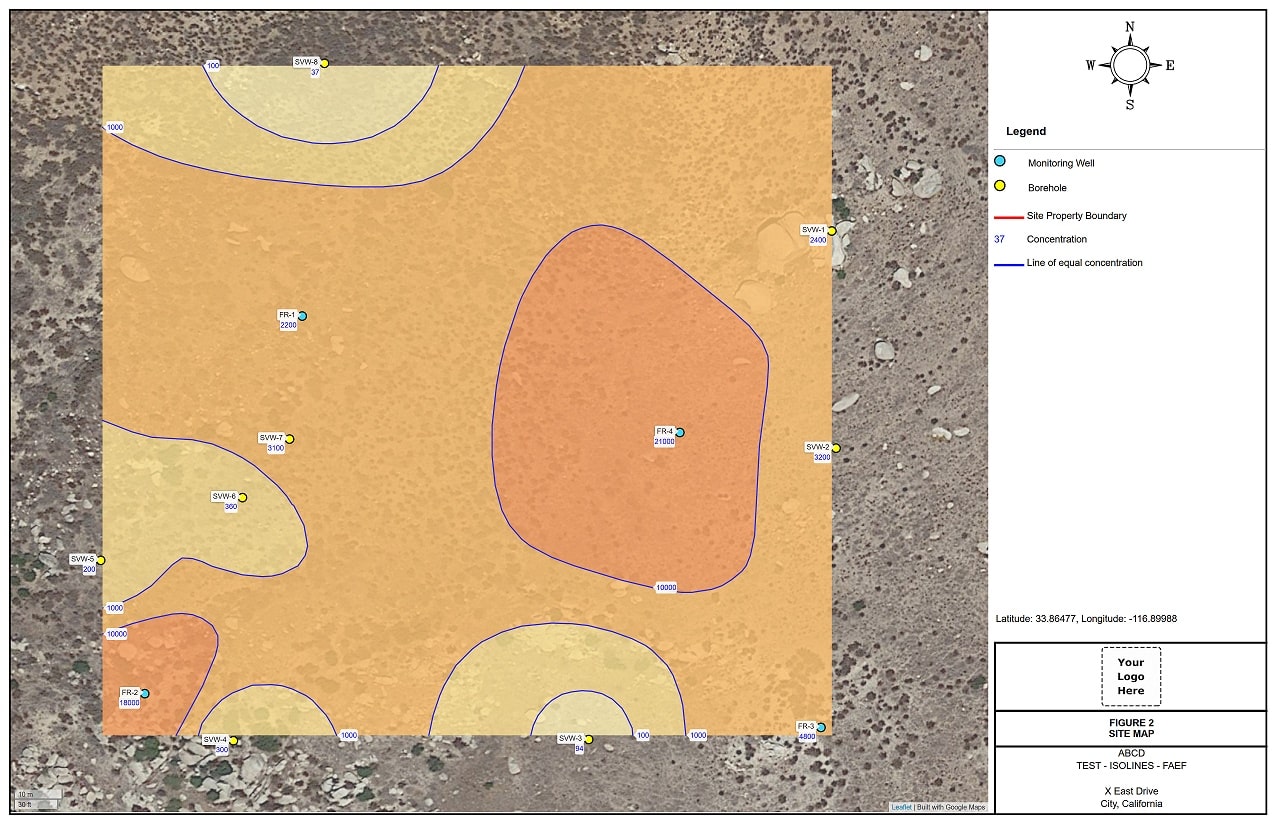
Isoconcentration Maps and Heat Maps Online
LOGitEASY Report Figure GIS software allows creating contaminant isoconcentration and heat maps for soil and groundwater monitoring, remediation and environmental site assessment reports. Generating maps does not require special GIS, CAD or modelling software knowledge.
Isoconcentration maps can be generated online using location data of previously logged LOGitEASY boreholes or using manually added or uploaded survey points.
Simply add a site (project), upload or add borehole locations and contaminant data and create automatic isconcentration and heat maps with a few clicks.
Reach out if you require georeferenced map data, monitoring wells or property parcel boundaries. We can provide geolocated files in AutoCAD dxf, geoJSON, ESRI shapefile, etc. formats in multiple coordinate systems for use with CADD, GIS or 3D modelling tools.
Isoconcentration Maps are delivered in PDF format, on 11x17” titleblock, including your logo, client name, site # or name, and site address.
Step-by-step video